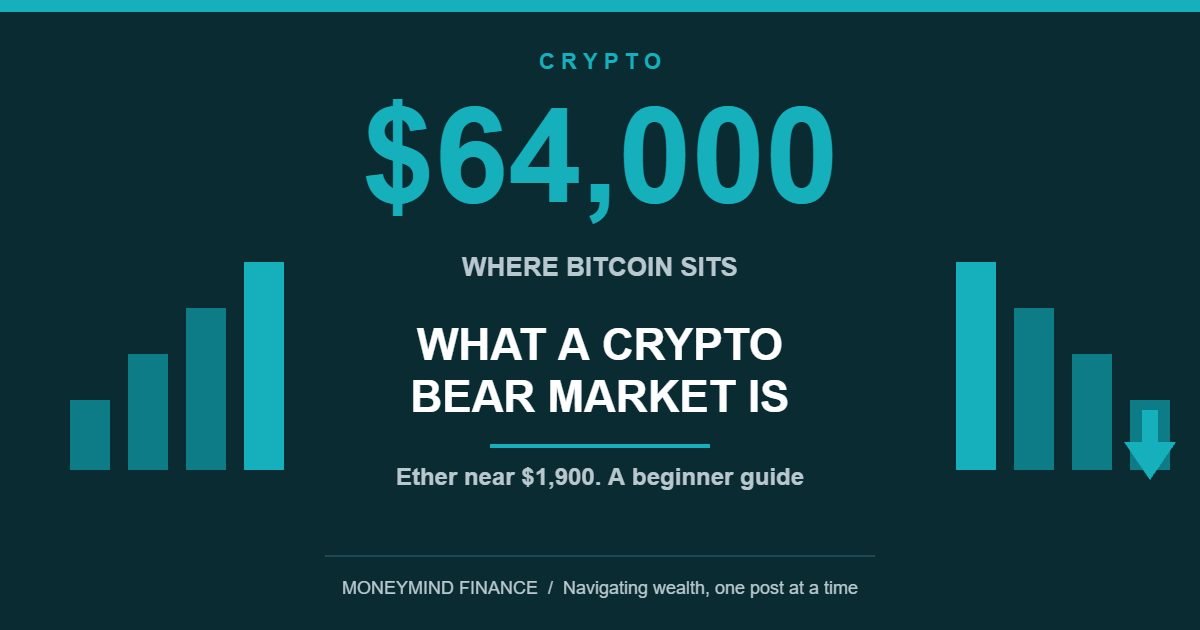
A crypto bear market is what happens when prices don't collapse suddenly but instead drift lower month after month, until the excitement drains out of the room. That is roughly where digital assets sit in August 2026. Bitcoin is trading around $64,000 and ether around $1,900, and both have been traded around those levels for weeks as the headlines have gone quiet. If you are new to this, understanding what a prolonged downturn actually looks like matters far more than guessing where the bottom is.
Below we break down the key terms, examine where the key largest cryptocurrencies stand, look at the flows driving them, and finish with the one number that is worth watching.
What a Crypto Bear Market Actually Means
A "bear market" is shorthand for a sustained fall in prices, conventionally 20% or more from a recent peak, persisting long enough to influence people's behavior. The opposite of a falling market, is a "bull market" where prices are rising. The phrases come from how each animal attacks: a bull thrusts its horns upward, a bear swipes downward.
The more useful term for a beginner is drawdown: how far an asset has fallen from its highest ever price. Drawdown matters because it tells you what actually holding the asset would have felt like, rather than what a tidy annual return figure suggests.
One thing worth internalising early: bear markets are a normal feature of volatile assets, not a malfunction. Cryptocurrencies have gone through several. What distinguishes them is depth and duration, and neither can be known in advance.
Where Bitcoin and Ether Stand Today
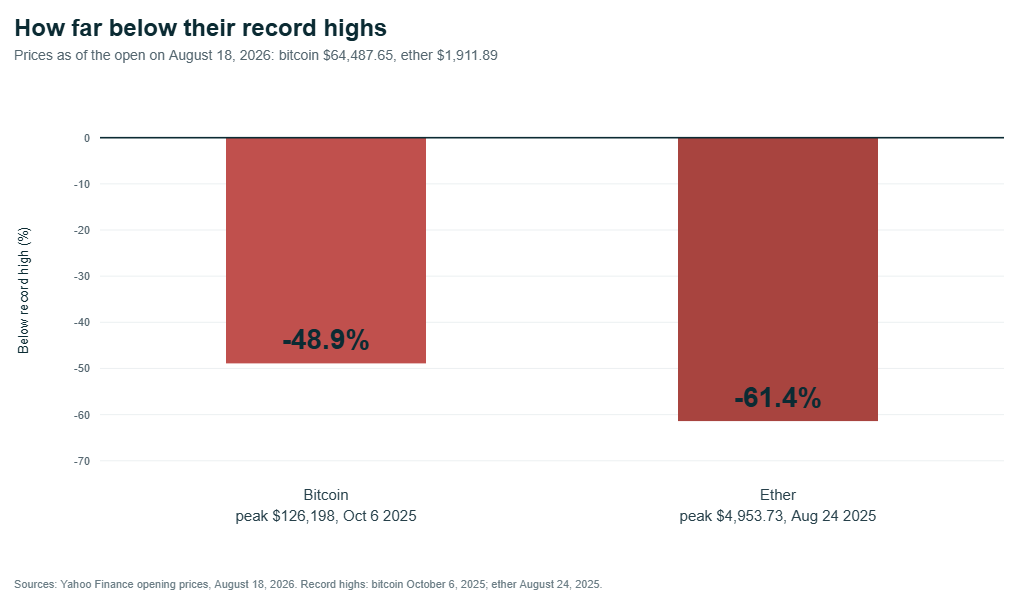
Bitcoin opened at $64,487.65 on Tuesday, August 18, 2026, while ether opened at $1,911.89, according to Yahoo Finance price data. Both were modestly higher than the previous day, and both remain far below where they were a year ago: bitcoin down 45.1% and ether down 57.3% over twelve months.
Measured against their record highs, the drawdowns are deeper still. Bitcoin peaked at $126,198 on October 6, 2025, so today's price is roughly half that. Ether peaked at $4,953.73 on August 24, 2025, leaving it around 60% below its high. Those are the numbers that put the phrase "bear market" into perspective.
Read: Bitcoin Price Predictions 2026: Why Experts Disagree, a useful reminder of how wide the range of forecasts is even among professionals.
Why ETF Flows Matter More Than the Daily Price
An ETF, or exchange-traded fund, is a fund you can buy and sell on a normal stock exchange just like a share. A spot bitcoin ETF holds actual bitcoin, so buying a unit gives you exposure without setting up a crypto wallet. Since these funds launched in the United States, they have become one of the main pipes through which everyday and institutional money reaches the asset.
That makes their "flows" revealing. Inflows mean more money entering the funds, which means the funds buy more bitcoin. Outflows mean the reverse. In the week to mid-August, U.S. spot bitcoin ETFs recorded four days of outflows totalling a net $390 million, the largest weekly withdrawal in six weeks, as reported by CoinDesk. Solana ETFs, by contrast, saw their strongest weekly inflows since mid-May.
Sentiment gauges tell a similar story. CoinMarketCap's Fear and Greed index sat at 38 out of 100, in "fear" territory. Such indexes summarise mood rather than value, so they are best treated as a thermometer, not a thermostat.
Regulation is the other overhang. Galaxy Research's Alex Thorn cut his estimated odds of the Clarity Act, a landmark U.S. crypto bill, becoming law in 2026 to roughly 10%, down from 60% in May, with prediction markets closer to 17%. A Senate procedural vote is scheduled for September 15.
Read: CLARITY Act Vote: 60 Needed, Republicans Hold 53, the vote math behind that 10% figure.
The Counter-Argument (And Why It's Serious)
The optimistic reading is that this is simply a quiet patch before the next upswing. The serious objection deserves a fair hearing.
The bear case is that this downturn is structural rather than cyclical. The ETFs that were supposed to bring a permanent new wave of buyers are now net sellers in some weeks. The regulatory clarity many expected has slipped, with the odds on landmark legislation collapsing from three-in-five to roughly one-in-ten within a few months. Ether's 57.3% twelve-month fall is far steeper than bitcoin's, which raises an uncomfortable question about whether demand for the broader ecosystem is weakening rather than merely pausing. Nothing guarantees that an asset which has halved will return to its previous high, and some never do.
The balanced response: the market has absorbed a great deal without breaking. Bitcoin has held above $60,000 through a bruising stretch of ETF withdrawals, geopolitical tension and thin summer liquidity. Implied volatility, a measure of how much turbulence traders expect, has been sitting near its lowest levels of the year, which suggests grinding boredom rather than panic. Fear readings and quiet markets have historically appeared near both bottoms and further declines. In short, the bear case is credible and unproven, and anyone claiming certainty in either direction is overreaching.
Read: Altcoins to Watch for how smaller cryptocurrencies behave when the two largest are stuck.
The One Number to Watch
Follow weekly net flows into U.S. spot bitcoin ETFs.
Daily price moves mostly reflect noise and short-term trading. Weekly ETF flows show something harder to fake: whether real money is arriving or leaving. A run of positive weeks would suggest new buyers are stepping in, which is what any durable recovery needs. A continued run of outflows like the recent $390 million week suggests the selling pressure has not yet exhausted itself. The figure is published weekly by several data providers and is quoted in most mainstream crypto coverage, so you do not need a subscription to follow it.
Read: Bitcoin Gold Correlation Hits 0.81 as Nasdaq Lags, what changed in the weeks after this piece was published.
Frequently Asked Questions
How long do crypto bear markets usually last?
There is no dependable answer. Previous downturns have lasted from several months to roughly two years, but the sample is small and each occurred under different conditions. Anyone offering a precise timeline is guessing.
What is the difference between a correction and a bear market?
A correction is generally a fall of about 10% that resolves fairly quickly. A bear market is deeper, usually 20% or more, and lasts long enough to change sentiment. The labels are conventions, not official definitions.
Why has ether fallen further than bitcoin?
Assets seen as higher risk usually fall harder when appetite for risk fades. Ether is more closely tied to activity across applications built on its network, so it tends to be more sensitive to changes in demand than bitcoin, which is more often held as a simple store of value.
Are ETF flows a reliable predictor of price?
They are informative, not predictive. Flows tell you what buyers and sellers have already done, which helps explain price behavior. They do not tell you what happens next, and they should be read alongside other evidence rather than on their own.
Read: why the latest Zcash vote kept its halving schedule intact
Disclaimer: Content on this site is for informational and educational purposes only and does not constitute financial, investment, or trading advice. I am not a licensed financial advisor. Always conduct your own research and consult a licensed professional before making investment decisions.