
Home Depot Stock: What Beginners Should Watch Now
Home Depot Stock: What Beginners Should Watch Now
If you've ever wondered how a hardware store can offer clue about the broader economy, Home Depot stock is one of the clearest windows we have into how ordinary households are spending their money. The company reported its latest quarterly results on August 18, 2026, and the figures reveals a more complex picture picture than a simple "good" or "bad" assessment: sales rose, profits rose, and yet slightly fewer people actually walked through the doors.
That combination is why this stock belongs on a watchlist while the story continue to unfold. Below we break down what the company's result, explain the key terms, examine the strongest argument against getting excited, and finish with the one number beginners should watch from here.
What Home Depot Just Reported, in Plain English
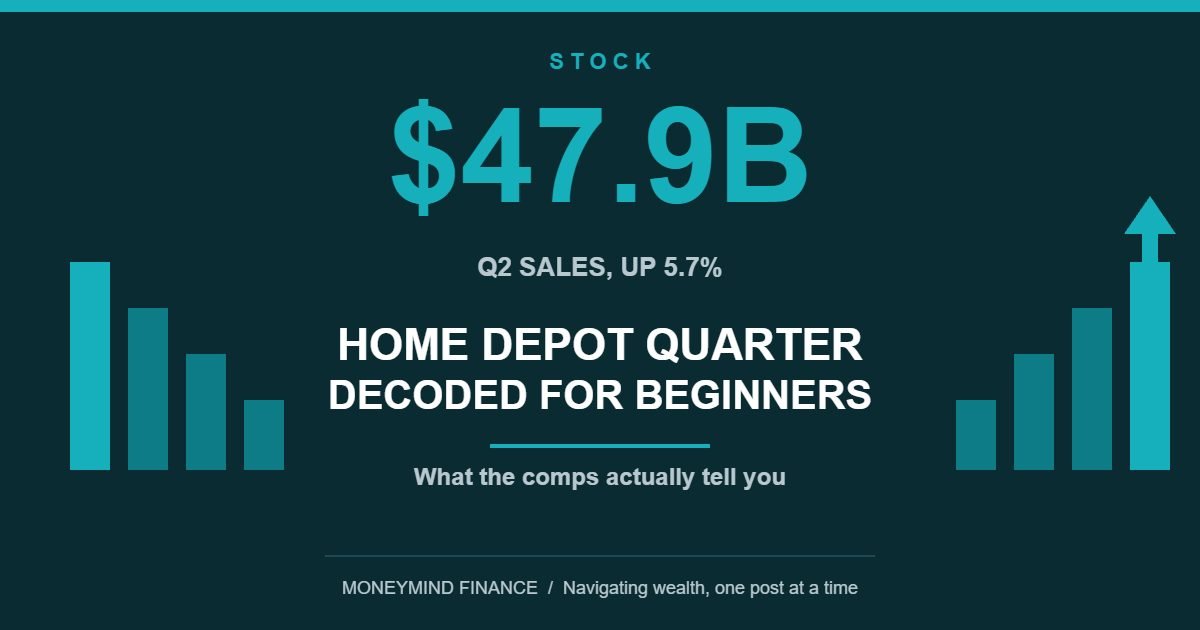
For the three months ended August 2, 2026, the company reported sales of $47.9 billion, up 5.7% from the same period a year earlier, according to its results filed with the U.S. Securities and Exchange Commission. Here are the headline figures, with the jargon translated:
- Net sales: $47.9 billion, up 5.7%. Simply the total value of everything sold.
- Comparable sales: up 1.7%. "Comparable sales" (often shortened to "comps") strips out the effect of newly opened stores, so you are comparing the same shops with themselves a year ago. It is the cleanest measure of whether a retailer is genuinely growing.
- U.S. comparable sales: up 1.3%. A little weaker than the group figure.
- Earnings per share: $4.79, up from $4.58. Earnings per share, or EPS, is profit divided by the number of shares in existence. It tells you how much profit each single share earned.
- Adjusted earnings per share: $4.92, up from $4.68. "Adjusted" means certain accounting costs have been stripped out, here the amortisation of intangible assets picked up through acquisitions. Adjusted figures tend to look flattering, so it is worth noting both.
The company also reaffirmed its guidance for the full financial year. "Guidance" is management's own forecast, and reaffirming it means sticking to the plan rather than raising or lowering expectations. That plan calls for total sales growth of roughly 2.5% to 4.5%, comparable sales somewhere between flat and up 2.0%, and an operating margin of about 12.4% to 12.6%. Operating margin is the share of every sales dollar left as profit after running costs, so 12.5% means roughly 12.5 cents of every dollar.
Why Home Depot Stock Is Worth Watching Right Now
This company sits at a useful crossroads. It sells to people improving the homes they already own, and to the professional tradespeople doing that work for them. When households feel confident, they take on bigger projects. When they feel squeezed, they patch things up and postpone the extension for another year. That makes the business a live read on both consumer confidence and the housing market.
The most revealing detail this quarter was not the headline growth at all. It was the split underneath it. Comparable customer transactions, essentially the number of visits and orders, fell 1.0%. Meanwhile the comparable average ticket, the amount spent per visit, rose 2.8%, from $90.01 to $92.50. Fewer visits, bigger baskets. Put those two together and you arrive at that 1.7% comparable sales growth.
Richard McPhail, the company's chief financial officer, said results "exceeded our expectations" and pointed to "broad based demand across the business as customers continued to engage in smaller projects," in comments reported by Yahoo Finance. Smaller projects are worth noting: they are what people take on when they are cautious but not retreating.
Read: Retail Earnings Week: What Beginners Should Watch for the wider picture on how retailers are faring this season.
The Counter-Argument (And Why It's Serious)
Here is the strongest case against getting carried away, and it deserves a fair hearing.
Growth driven by a bigger average ticket rather than by more customers is not the same quality of growth. Across the first six months of the financial year, comparable customer transactions were down 1.2%, and the raw transaction count fell to 443.2 million in the quarter from 446.8 million a year earlier. A retailer can lean on higher prices or a richer product mix for a while, but not forever if the number of people showing up keeps drifting downward.
Costs are the second concern. Total operating expenses rose 8.2% in the quarter, comfortably faster than the 5.7% sales growth. That squeezed the operating margin to 14.3% from 14.5% a year earlier. Across the first half of the year, operating income rose just 1.1% and net earnings just 0.9%, far slower than the sales line alone would suggest.
The measured response: none of this is a crisis, and some of it is explainable. Comparable sales of 1.7% were an acceleration from 1.0% in the same quarter a year ago, so the trend is improving rather than deteriorating. Management was confident enough to reaffirm the full-year outlook. And a falling transaction count paired with a rising ticket can reflect a real shift in what customers buy, not simply higher prices. The honest position is that this tension is unresolved, which is exactly what makes the shares interesting to monitor rather than something to form a firm view on today.
The One Number to Watch
If you follow only one figure from here, make it comparable customer transactions.
Almost everything else in this quarter can be read two ways, but that number answers one unambiguous question: are more people choosing to shop here, or fewer? Right now the answer is fewer, by 1.0%. If it turns positive in coming quarters while the average ticket holds up, that would point to genuinely broadening demand. If it keeps falling while growth leans ever harder on ticket size, the story becomes considerably more fragile. You will find it in the "selected sales data" table of every quarterly results release.
Read: CPI Report Week: What Beginners Should Watch, which explains why average tickets can rise even as visits fall.
Frequently Asked Questions
What are comparable sales, and why do they matter?
Comparable sales measure growth at stores that have been open long enough to compare fairly with last year. Without that adjustment, a chain could look like it is growing simply by opening new shops. Comps tell you whether the existing business is getting stronger or weaker.
What is the difference between earnings per share and adjusted earnings per share?
Earnings per share follows standard accounting rules. Adjusted earnings per share removes items management considers unrepresentative, such as amortisation from acquisitions. Neither is inherently the truth. Reading both, and noting the gap between them, is the sensible habit.
Does a strong earnings report mean the share price will rise?
Not reliably. Share prices tend to move on results relative to what investors already expected, not on whether the numbers were good in absolute terms. A company can beat expectations and still see its shares fall if the outlook disappoints, and the reverse happens too.
How often are these results published?
Four times a year. Large U.S. companies report quarterly, and the announcements are published on their investor relations pages and filed with the Securities and Exchange Commission, so anyone can read the original document for free rather than relying on a summary.
Read: our Nike stock watch score and five-year scenarios
Disclaimer: Content on this site is for informational and educational purposes only and does not constitute financial, investment, or trading advice. I am not a licensed financial advisor. Always conduct your own research and consult a licensed professional before making investment decisions.
All Categories
Recent Posts
Fed Minutes Wednesday: Hike Odds Fall to 22% After 29K Jobs
PCE Inflation Report: Fed Just Hiked to 4%

HSA for Beginners: The 2027 Limit Is $4,500
Tags

Navigating wealth, One post at a time