
Market Breadth: Why Record Highs Rest on a Few Stocks
Market Breadth: Why Record Highs Rest on a Few Stocks
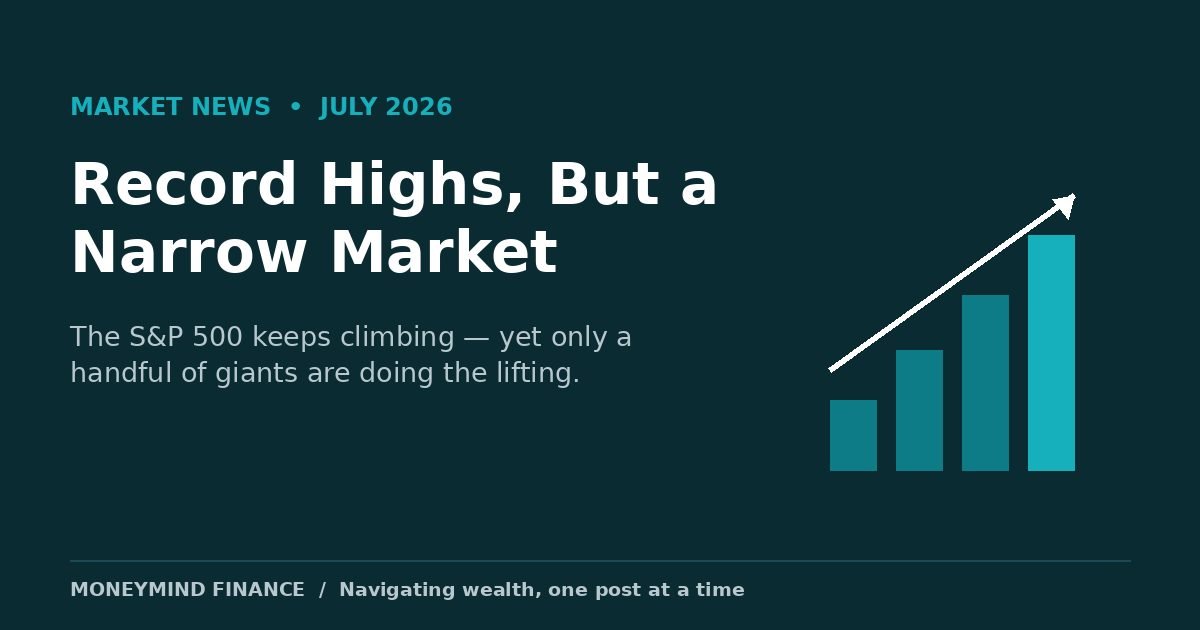
If you glanced at the headlines on Friday, July 10, 2026, everything looked wonderful. The S&P 500 closed at a fresh high of 7,575.39, up 0.42% on the day and more than 1% for the week. The Dow and the Nasdaq rose too. But underneath that cheerful scoreboard is a quieter story that every new investor should understand: the market keeps setting records while only a small handful of giant companies are actually doing the heavy lifting. That gap between "the market" and "most stocks" has a name, market breadth and right now it is unusually narrow. Here is what that means, in plain English, and why it matters for you.
What "Record Highs" Actually Mean Right Now
First, a quick vocabulary check. The S&P 500 is an index, a basket that tracks 500 of the largest companies listed in the United States. When people say "the market went up," they usually mean an index like this one. Think of it as the market's report card.
Here is the catch: not every company in that basket counts equally. The S&P 500 is weighted by market capitalization (or "market cap"), which is simply a company's share price multiplied by how many shares exist. A giant like Nvidia has a market cap in the trillions, so its stock moves the index far more than a mid-sized company does. When a few of the biggest names rise sharply, they can drag the whole index to a record, even if hundreds of smaller companies are flat or falling that day.
Friday was a perfect example. Meta Platforms jumped about 6% and Nvidia rose roughly 4%, while South Korean memory-chip maker SK Hynix soared around 13% in its record-breaking $26.5 billion Wall Street debut. Meanwhile the index as a whole gained just 0.42%. A few names ran; the crowd barely jogged.
| Mover (July 10, 2026) | One-day change |
|---|---|
| SK Hynix (Nasdaq debut) | +13% |
| Meta Platforms | +6% |
| Nvidia | +4% |
| S&P 500 (whole index) | +0.42% |
Meet "Market Breadth" the Market's Hidden Health Check
Market breadth measures how many stocks are participating in a rally, not just how high the index goes. Imagine a parade. "Wide" breadth is a full marching band, hundreds of players moving together. "Narrow" breadth is four star soloists carrying the tune while everyone else stands still. Both can sound loud from a distance, but one is a lot more fragile.
Right now the market is leaning on those soloists, the mega-cap technology companies (the very largest firms, mostly tied to artificial intelligence). Meta, for instance, extended its weekly gain to almost 15%, its best week since early 2024, after analysts flagged that it may be improving how efficiently it spends on AI. When a rally depends this heavily on a few names, strategists get uneasy, because if those leaders stumble, there aren't enough other rising stocks to hold the index up.
This is not a doom signal by itself. Narrow markets can stay narrow for a long time. But it is a reason to look past the headline number and ask, "Is this rally healthy, or is it balancing on a few shoulders?" Read: Russell 2000 Small Caps: Rotation or Rate-Cut Sugar High? for how smaller companies fit into this picture.
Why the Fed Is Making Investors Nervous
The other cloud on the horizon is the Federal Reserve often just called "the Fed." It is the United States' central bank, and its main job is keeping prices stable and employment healthy. Its most powerful tool is the interest rate it sets, which ripples out to the cost of mortgages, car loans, and business borrowing. When the Fed raises rates, borrowing gets more expensive, spending tends to cool, and fast-growing tech stocks often feel the most pressure.
Lately, inflation has been sticky. Inflation is the rate at which prices rise over time; the CPI (Consumer Price Index) is the best-known scorecard for it. Recent readings have run above the Fed's comfort zone, with headline CPI reported around 4% year-over-year. As a result, some Fed officials have signaled they are more worried about inflation than about jobs, and futures markets have begun pricing in a small chance of an interest-rate hike at the late-July meeting rather than the cuts investors once expected. For a market leaning on richly priced tech names, even the hint of higher rates is enough to rattle nerves. Since then the picture has shifted a little as inflation cooled — Read: Stock Market Week Ahead: Inflation Cools, Fed in Focus for the latest CPI reading and what it means for the Fed's July 29 decision.
The Counter-Argument (And Why It's Serious)
It would be fair to push back and say: "Aren't you overthinking a market that just hit a record?" The bullish case is genuinely strong. The companies leading this rally are not fragile startups, they are hugely profitable businesses with real earnings, mountains of cash, and booming demand for AI computing. Narrow leadership by high-quality giants is very different from narrow leadership by speculative junk. History shows markets can grind higher for months, even years, while a few leaders dominate, and betting against them has burned plenty of cautious investors.
That argument deserves respect. But here is the measured rebuttal: concentration cuts both ways. When the same handful of stocks makes up a record share of the index, your "diversified" fund is quietly less diversified than it looks, a wobble in two or three names can drag down the whole market. Add a Fed that may keep rates higher for longer, and the stocks most sensitive to rates are the very ones holding the index up. None of this predicts a crash. It simply means the cushion is thinner than the record-high headline suggests, and thin cushions deserve attention.
The One Number to Watch
If you track just one thing from here, make it market breadth specifically, the share of S&P 500 stocks trading above their 200-day average price (a common, free "how many stocks are healthy?" gauge you can find on most finance sites). When that number is high, the rally is broad and sturdy. When the index keeps climbing but that share shrinks, it is a warning that fewer and fewer stocks are holding the market up. Watching breadth teaches you to see the whole parade, not just the soloists. Read: 3 AI and Tech Stocks to Watch in 2026 to understand the giants at the center of it all.
Frequently Asked Questions
Q: If the market is at a record high, why should I worry at all?
A: You don't need to panic, records are normal and healthy over time. The point is awareness: a record built on a few giant stocks is more fragile than one built on hundreds rising together. Knowing that helps you set realistic expectations, not fear.
Q: What is "market breadth" in one sentence?
A: It's a measure of how many stocks are rising, which tells you whether a rally is broad and sturdy or narrow and dependent on a small group of leaders.
Q: Does a possible Fed rate hike mean I should sell?
A: Not necessarily, and reacting to a single meeting is rarely wise. Higher rates can pressure fast-growing stocks, but for long-term investors the steadier approach is a diversified plan and regular contributions rather than trying to time the Fed.
Q: How can a beginner actually check market breadth?
A: Free finance sites and brokerage dashboards often show breadth indicators like the percentage of stocks above their 200-day average, or "advancers vs. decliners." You don't need to calculate anything, just watch whether the trend is widening or narrowing.
Read next: Market Week Ahead: Fed Meeting and Big Tech Earnings
Disclaimer: Content on this site is for informational and educational purposes only and does not constitute financial, investment, or trading advice. I am not a licensed financial advisor. Always conduct your own research and consult a licensed professional before making investment decisions.
All Categories
Recent Posts
JPMorgan Stock to Watch: $15.3B Profit, Buffer at 13.9%
Delta Stock to Watch: Fuel Up 75%, Profit Still Held
Fed Minutes Wednesday: Hike Odds Fall to 22% After 29K Jobs
Tags

Navigating wealth, One post at a time